PreLab: Getting Started
Overview
The purpose of this lab is to introduce some of the functionality and structure of Google Earth Engine (GEE) before we get into the practical labs. This tutorial will provide a brief introduction to the GEE Javascript interface (the Code Editor) and using GEE resources. At the completion of the lab, you will be able to access GEE imagery, upload your own assets, and explore the metadata for a given feature.
Learning Outcomes
- Navigate basic GEE Resources
- Describe the major GEE data types and their associated methods
Setting up an Account
To begin, ensure you sign-up for the Google Earth Engine here. Registration is free and straightforward, but it takes approximately 24 hours to be approved to use the code editor. While waiting, let’s get familiar with the Google Earth Engine. The video below is a quick introduction to Google Earth Engine that Ozzy assembled to to get you familiar with the available resources.
Importing data
In addition to the petabytes of satellite imagery and products that GEE has available, Google Earth Engine also allows you to work with your own raster, vector, and tabular data. This is process is automatically linked to the Google Drive account that signed up for GEE.
If you are not familiar with Google Drive, the ‘Getting Started Guide’ reviews the basics of initializing and organizing your Google Drive account. Although Google Cloud Platform Storage is beyond the scope of this course, below is some additional helpful documentation on working with external data.
- Managing Assets
- Import Raster
- Import Vector / Tabular Data ** Note that GEE only supports Shapefiles and
.csvfiles *** - Exporting Data
Gecomputation with GEE: Server vs. Client
Understanding the basics of how Google Earth Engine works is critical for its effective use. The Developer’s overview provides much more detail on the intricacies of how GEE processes data on the Google Cloud Platform, but in the simplest terms, there are two sides to the process - the client side and server side.
When you open your web browser and begin to work in the code editor, that is considered the client side. You can write JavaScript code in the editor and the code will be processed within your browser. The code below simply creates a variables x and y, adds them together as the variable z and prints the result, which shows up in the console of the code editor. Even though the code is written in the GEE editor, it plays no role in the execution of this code - your browser executes it.
var x = 1; var y = 2;
var z = x + y;
print(z)
To begin using the cloud computing resources of GEE effectively, we can then call upon the server side of the operations. Let’s say we want to import an image collection. In the snippet below, you can see that there is an ee before the ImageCollection constructor. In simple terms, this signals to Earth Engine that we will be using its resources. Without that indicator, GEE will cede operations to the server.
var sentinelCollection = ee.ImageCollection('COPERNICUS/S2_SR');Over time, you will gain experience understanding the role of working with JavaScript on the client side and the server side, but the main point in this section is that when programming, we will be building ‘packages’ that draw upon GEE resources to complete their operations.
An extension of this topic is listed here, along with discussions of programming specific topics (i.e., mapping instead of looping).
JavaScript
The intent of this course is not to teach the intricacies of programming within JavaScript. JavaScript is the core language for web development, and you will likely find that many of the tutorials and resources you find will not be directly relevant to the type of JavaScript that you will need to work in Earth Engine (ie, working with React, JQuery, dynamic app development, etc). JavaScript was chosen because it is an extremely popular language (~97% of websites use it in some fashion) and as an object-oriented language, it is well-suited to pair objects (in this case, imagery provided by Google Earth Engine) with methods (such as using the reduce function to summarize the analytical information from a processed image).
Several excellent resources exist that can help you in working with JavaScript. One such resource is Javascript.info, which provides a thorough overview of working with JavaScript. In this tutorial, focus on part I, as part II and III are focused on web development.
W3Schools provides good information on each individual component of working with JavaScript. For instance, if you see the word var and wanted more information on it, W3Schools has some helpful definitions and code snippets that will be of use.
Finally, JavaScript & JQuery is an excellent, well-designed book that goes through the fundamentals of working with JavaScript and provides helpful illustrations and use cases. The second half of the book is outside the scope of this course, but if you did want to extend your skill-set, this book is a great starting point.
0.1 Data and Methods
Core Components of Google Earth Engine Operations
Most Google Earth Engine tutorials begin with an introduction to the data structures and the operations you can use to analyze your data structures. To work effectively with GEE, it is essential that you understand these core components and how to complete basic operations with each of them.
Image- Raster Image, a fundamental data type within Earth Engine
ImageCollection- A “stack” or sequence of images with the same attributes
Geometry- Vector data either built within Earth Engine or imported
FeatureGeometrywith specific attributes.
FeatureCollection- Set of features that share a similar theme
Reducer- A method used to compute statistics or perform aggregations on the data over space, time, bands, arrays, and other data structures.
Join- A method to combine datasets (
ImageorFeaturecollections) based on time, location, or another specified attribute
- A method to combine datasets (
Array- A flexible (albeit sometimes inefficient) data structure that can be used for multi-dimensional analyses.
0.2 Images and Image Collections
0.2.1 Images
Images are Raster objects composed of:
- Bands, or layers with a unique:
- Name
- Data type
- Scale
- Mask
- Projection
- Metadata, stored as a set of properties for that band.
You can create images from constants, lists, or other objects. In the code editor ‘docs’, you’ll find numerous processes you can apply to images.
Ensure that you do not confuse an individual image with an image collection, which is a set of images grouped together, most often as a time series, and often known as a stack.
0.2.2 Image Collections
Let’s analyze the code below, which is an established method of extracting one individual image from an image collection. You can copy and paste this code snippet into the code editor to follow along.
On the first line, we see that we are creating a JavaScript variable named first, and then using ee in front of ImageCollection, which signifies we are requesting information from GEE. The data we are importing (‘COPERNICUS/S2_SR’) is the Sentinel-2 MSI: MultiSpectral Instrument, Level-2A, with more information found in the dataset documentation.
The next four steps further refine the extraction of an image from an image collection.
.filterBoundsfilters data to the area specified, in this case a geometry Point that was created within GEE..filterDatefilters between the two dates specified (filtering down to images collected in 2019).sortorganizes the images in descending order based upon the perentage of cloudy pixels (this is an attribute of the image, which can be found in the ‘Image Properties’ tab in the dataset documentation).firstis a JavaScript method of choosing the first image in the list of sorted images
As a result, we can now use the JavaScript variable ‘first’ to visualize the image.
Map.centerObject() centers the map on the image, and the number is the amount of zoom. The higher that value is, the more zoomed in the image is - you’ll likely have to adjust via trial-and-error to find the best fit.
Map.addLayer() adds the visualization layer to the map. Image/image collections will each have a unique naming convention of their bands, so you will have to reference the documentation. GEE uses Red-Green-Blue ordering (as opposed to the popular Computer Vision framework, OpenCV, which uses a Blue-Green-Red convention). min and max are the values that normalize the value of each pixel to the conventional 0-255 color scale. In this case, although the maximum value of a pixel in all three of those bands is 2000, for visualization purposes GEE will normalize that to 255, the max value in a standard 8-bit image.
There is a comprehensive guide to working on visualization with different types of imagery that goes quite in-depth on working with different types of imagery. It is a worthwhile read, and covers some interesting topics such as false-color composites, mosaicking and single-band visualization. Work with some of the code-snippets to understand how to build visualizations for different sets of imagery.
var first = ee.ImageCollection('COPERNICUS/S2_SR')
                .filterBounds(ee.Geometry.Point(-70.48, 43.3631))
                .filterDate('2019-01-01', '2019-12-31')
                .sort('CLOUDY_PIXEL_PERCENTAGE')
                .first();
Map.centerObject(first, 11);
Map.addLayer(first, {bands: ['B4', 'B3', 'B2'], min: 0, max: 2000}, 'first');
0.2.3 Sensed versus Derived Imagery
One additional note: GEE provides a rich suite of datasets, and while many of them are traditional sensed imagery, others are derived datasets. For instance, the Global Map of Oil Palm Plantations dataset provides is derived from analysis on the Sentinel composite imagery. If you look at the ‘Bands’, there are only three values, which refer to categories of palm plantations. Datasets such as these will have different methods for visualizing the data or working as a mosaic.
0.3 Geometries
Google Earth Engine handles vector data with the Geometry type. Traditionally, this means
- Point
- Line
- Polygon
However, GEE has several different nuances.
PointLineString- List of Points that do not start and end at the same location
LinearRing- LineString which does start and end at the same location
Polygon- List of LinearRing’s - first item of the list is the outer shell and other components of the list are interior shells
GEE also recognizes MultiPoint, MultiLineString and MultiPolygon, which are simply collections of more than one element. Additionally, you can combine any of these together to form a MultiGeometry. Here is a quick video of working with the Geometry tools within GEE.
Once you have a set of geometries, there are geospatial operations you can use for analysis, such as building buffer zones, area analysis, rasterization, etc. The documentation contains some basic examples to show you how to get started, although there are many more functions listed under the ‘Docs’ tab in the Code Editor.

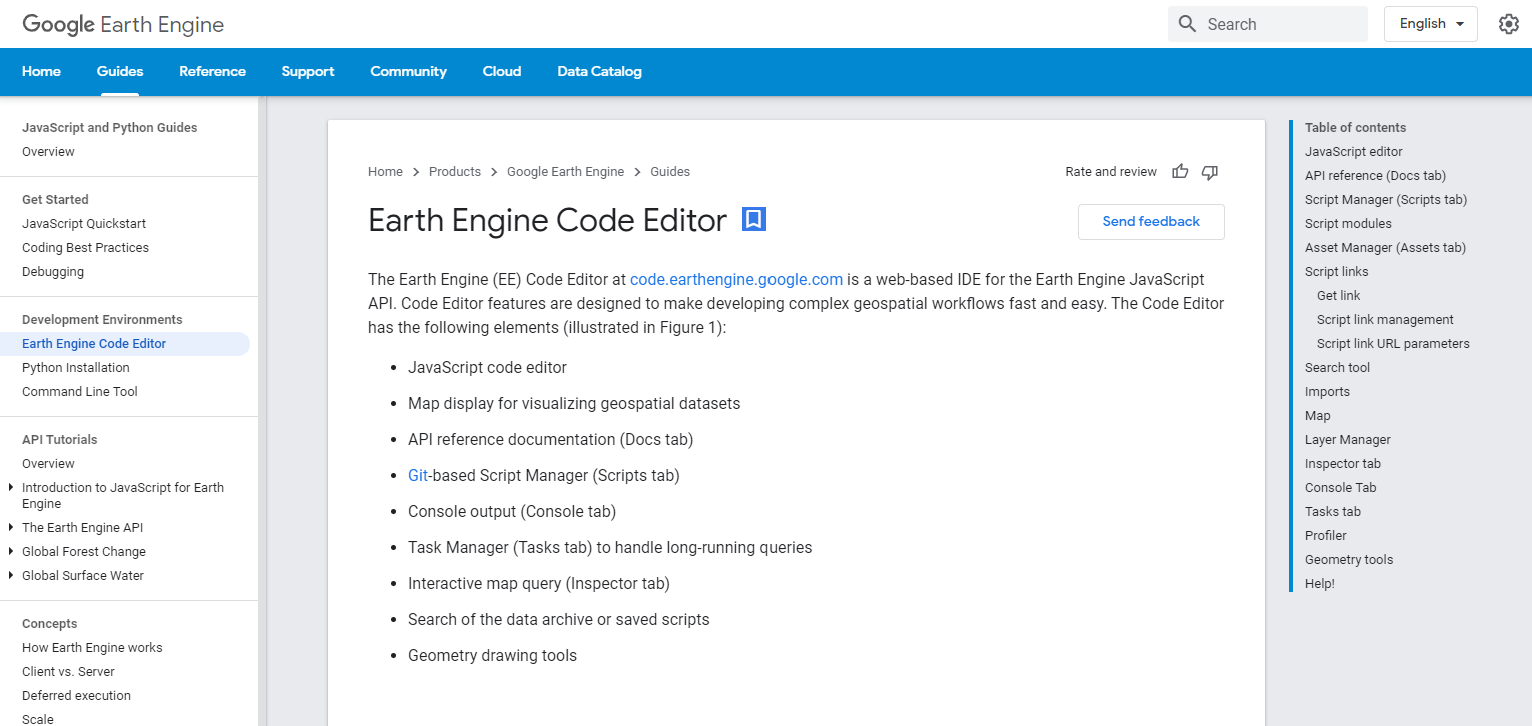
Figure 0.1: A view of the google earth engine code editor
0.4 Features and Feature Collections
0.4.1 Features
At the most basic definition, a Feature in GEE is an object which stores a geometry property (Point, Line, Polygon) along with it’s associated properties. GEE uses the GeoJSON format to store and transmit these features. In the previous video, we saw how to build geometries within Google Earth Engine, a feature adds meaningful information to it. This would be a good section to review working with dictionaries with JavaScript.
Let’s say we created an individual point, which we want to associate with data that we collected. The first line establishes the variable point, which is then used as the geometry to create a feature. The curly braces represent a JavaScript dictionary, which creates Key:Value pairs, which in our case is the type of tree and a measurement of the size. this new variable, treeFeature, now contains geographic information along with attribute data about that point.
// geometry created from within GEE
var point = ee.Geometry.Point([-79.68, 42.06]);
// Create a Feature from the geometry
var treeFeature = ee.Feature(point, {type: 'Pine', size: 15});
Obviously this is just one point, but JavaScript and GEE engine provide functionality for bringing different data sources together and automatically associating geometries with attribute data. This can be done within GEE or outside, depending on your preferences.
0.4.2 Feature Collections
Just like the relationship between images and image collections, Feature Collections are Features that can be grouped together for ease of use and analysis. They can be different types and combinations of geometry, as well as associated tabular data. The code segment from the documentation consolidates the operations discussed earlier. Each line has an interior layer which creates the geometry (ee.Geometry.---() ), which is then associated with attribute data (information within the {} ) and then converted to a Feature. This variable is a JavaScriptlist, which contains three separate features. This is then converted to a Feature Collection with the command ee.FeatureCollection(features)
// Make a list of Features.
var features = [
  ee.Feature(ee.Geometry.Rectangle(30.01, 59.80, 30.59, 60.15), {name: 'Voronoi'}),
  ee.Feature(ee.Geometry.Point(-73.96, 40.781), {name: 'Thiessen'}),
  ee.Feature(ee.Geometry.Point(6.4806, 50.8012), {name: 'Dirichlet'})
];

// Create a FeatureCollection from the list and print it.
var fromList = ee.FeatureCollection(features);
print(fromList);
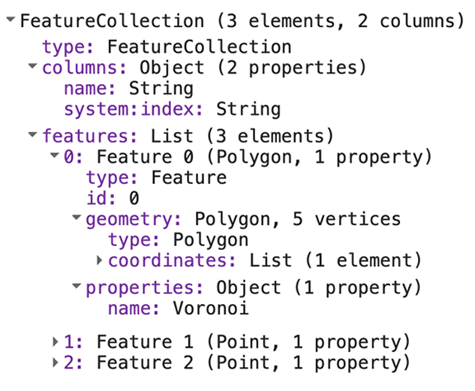
If you take this code block and run it in Google Earth Engine, you can see the information that is contained within the FeatureCollection, which has three elements (Features) and two columns (the index and the properties). By clicking on the dropdown next to each one, you can see that the first feature is a Polygon that has the name of ‘Voronoi’.

Once you have information in a Feature Collection, you can filter it to find specific information, such as the name of an object or based on the size of a polygon, or provide aggregated analysis. The documentation on working with Feature Collections is comprehensive, and provides many ideas on how to use them efficiently in in your analysis.
0.5 Methods: Reducers
Up until now, we have focused on objects: Images, Features, and Geometries. Reducers are a method of aggregating data for analysis. For instance, we could take an Image Collection and use reducer to find the average value at each pixel, resulting in a single layer. Or we could reduce an image to a set of regions, grouping similar data together to create a simplifed map. The applications of Reducer are endless, and can be applied to both Images and Features. There are different functions for different object types, and Reducer can be both combined and sequenced to create a chain of analysis. From the documentation, the code chunk below creates the variable collection which is a collection that is filtered to the year 2016 and defined to a specific point. The variable extrema then reduces the dataset to identify the minimum and maximum value at that specific point for every band.
// Load and filter the Sentinel-2 image collection.
var collection = ee.ImageCollection('COPERNICUS/S2')
    .filterDate('2016-01-01', '2016-12-31')
    .filterBounds(ee.Geometry.Point([-81.31, 29.90]));
// Reduce the collection.
var extrema = collection.reduce(ee.Reducer.minMax());
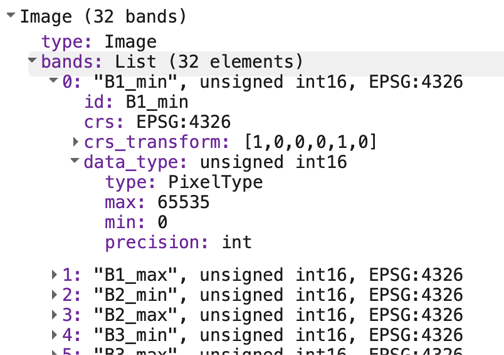
If you print extrema in the console, you can see that the result is 32 separate ‘bands’, which represents the minimum and maximum value for all 16 bands in the Sentinel data. In the screenshot below, you can expand the first ‘band’, which identifies the attributes of the minimum value of Band 1.

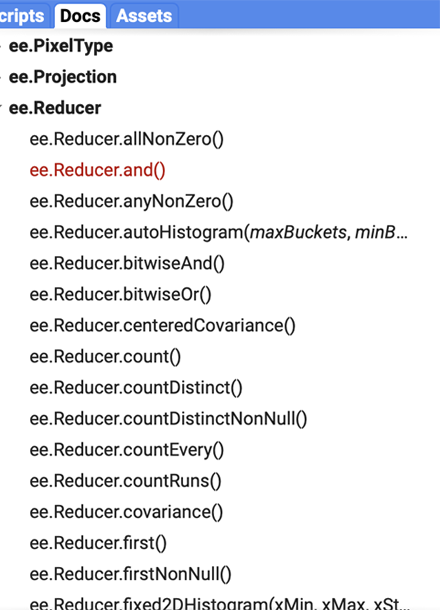
There are hundreds of different operations for using Reducer, with the functions listed on the left hand table under ‘Docs’. Certain functions will only work with specific object types, but follow along with the Reducer documentation to get a better understanding of how to aggregate data and extract meaningful results. Getting familiar with Reducer is an essential component to working with Google Earth Engine.

0.6 Joins and Arrays
0.6.1 Join
If you have programmed in the past, joining data togetgher is likely a familiar concept. This process assicates information from one set of data with relevant data from another set on a specific attribute. Let’s say you have an Image Collection of Landsat data that is filtered to the first six months of the year 2016 and a bounding box of your area of study. You also have a table of Redwood tree locations that is filtered to the same area of study, although it contains information over the past decade. You can use a Join to associate information about the trees from the Feature Collection and include it in the Image Collection, keeping only the relevant data. You now have a dataset with useful information from both the Image Collection and Feature Collection in one location. Although there are different types of joins, the process brings information together, keeping only relevant information. The documentation on Joins goes over specific examples and concepts, but a crucial component is understanding the type of join you need the three most prominent within GEE are:
- Left Join
- Keeps all the information from the primary dataset, and only information that joins from the secondary datset
- Inner Join
- Keeps only the information where the primary and secondary data match
- Spatial Join
- A join based on spatial location (ie, keep only the geometry points that fall within a specified buffer)
GEE provides some unique types of joins, including ‘Save-All’, ‘Save-Best’ and ‘Save-First’, which are useful if you want to look at a specific area.
0.6.2 Arrays
Arrays are a collection of data where information is stored contiguously - matrices are a multi-dimensional array. For instance, an image might have 1024 rows and 1024 columns. Each row is an array, each column is an array, and taken together, you have a 2-dimensional array, also known as a matrix. If the image has three separate color channels, then that is a 3-dimensional array. Some of the terminology changes depending on discipline (ie, physics vs. computer science), but if you are familiar with working with matrices and arrays in programming languages such as Matlab or OpenCV, it is important to understand the role of arrays within GEE.
In fact, Google Earth Engine states that working with arrays outside of the established functions that they have built is not recommended, as GEE is not specifically designed for array-based math, and will lead to unoptimized performance.
There is a very informative video that delves into the engineering behind Google Earth Engine, but in this course we will only be doing a limited amount with array transformations and Eigen Analysis. In many cases, you will probably be better off aggregating the specific data and then conducting array mathematics with programming frameworks geared to that context.